Skip to content

scatter plot and hexbin plot lose x-axis when colorbar is included. #20446

New issue

Have a question about this project? Sign up for a free GitHub account to open an issue and contact its maintainers and the community.

By clicking “Sign up for GitHub”, you agree to our terms of service and privacy statement. We’ll occasionally send you account related emails.

Already on GitHub? Sign in to your account

Merged
merged 85 commits into from
Jul 4, 2018

Conversation

javadnoorb
Copy link
Contributor

@javadnoorb javadnoorb commented Mar 22, 2018

closes #10611
closes #10678.

The x-axis for scatter plot and hexbin plot disappears when colorbar is included. This seems to be because colorbar axis is looped through in _handle_shared_axes:

_handle_shared_axes(axarr=all_axes, nplots=len(all_axes),

after discussing with @TomAugspurger (issue #10611), we decided to try adding the attribute __is_pandas_colorbar to colorbar axis object and skipping it during handling of shared axes.

I've done some tests that seem to fix the issue. But we may need more tests:

%matplotlib inline
import matplotlib.pylab as pl
from mypandas import pandas as pd
import numpy as np
random_array = np.random.random((1000,3))

df = pd.DataFrame(random_array,columns=['A label','B label','C label'])
df.plot.scatter('A label','B label',c='C label', PATCH_MODE_FLAG = False);pl.title('pandas current version');
df.plot.scatter('A label','B label',c='C label', PATCH_MODE_FLAG = True);pl.title('patch fixing x-axis');

df.plot.hexbin('A label','B label', gridsize=25, PATCH_MODE_FLAG = False);pl.title('pandas current version');
df.plot.hexbin('A label','B label', gridsize=25, PATCH_MODE_FLAG = True);pl.title('patch fixing x-axis');

image
image
image
image

@TomAugspurger TomAugspurger added the Visualization plotting label Mar 22, 2018
@TomAugspurger
Copy link
Contributor

Thanks, let us know when you're ready for us to take a look.

How does this work with subplots=True? Do we not have to worry about that since it's a scatter plot?

How does this work with user-specified axes via ax=? Especially with multiple subplots. It may already be broken, so no worries if it doesn't work well.

@javadnoorb
Copy link
Contributor Author

javadnoorb commented Mar 22, 2018

Yes, it's already broken. Please feel free to take a look:

def make_multiplots(numrows=2,numcols=2,sharey=True,sharex=True,PATCH_MODE_FLAG = True, is_scatter = True):
    fig, axes = pl.subplots(numrows,numcols,sharey=sharey,sharex=sharex )
    for i in range(axes.shape[0]):
        for j in range(axes.shape[1]):
            random_array = np.random.random((1000,3))
            df = pd.DataFrame(random_array,columns=['A label','B label','C label'])
            if is_scatter:
                df.plot.scatter('A label','B label',c='C label', PATCH_MODE_FLAG = PATCH_MODE_FLAG,ax=axes[i,j]);
            else:
                df.plot.hexbin('A label','B label',gridsize=20, PATCH_MODE_FLAG = PATCH_MODE_FLAG,ax=axes[i,j]);
            
            
make_multiplots(numrows=2,numcols=2,sharey=True, sharex=True, PATCH_MODE_FLAG = False, is_scatter=True);pl.suptitle('pandas current version');            
make_multiplots(numrows=2,numcols=2,sharey=True, sharex=True, PATCH_MODE_FLAG = True, is_scatter=True);pl.suptitle('patch fixing x-axis');            
make_multiplots(numrows=2,numcols=2,sharey=True, sharex=True, PATCH_MODE_FLAG = False, is_scatter=False);pl.suptitle('pandas current version');            
make_multiplots(numrows=2,numcols=2,sharey=True, sharex=True, PATCH_MODE_FLAG = True, is_scatter=False);pl.suptitle('patch fixing x-axis');  

image
image
image
image

Copy link
Contributor

@TomAugspurger TomAugspurger left a comment

Choose a reason for hiding this comment

The reason will be displayed to describe this comment to others. Learn more.

I would say make a new issue for subplots, and ignore it for now.

As for testing, how about we make two plots, one with c and one without, and assert that the tick labels are the same?

fig, ax = plt.supblots()
df.plot.scatter(x='x', y='y', ax=ax)

fig, ax2 = plt.subplots()
df.plot.scatter(x='x', y='y', c='c', ax=ax2)

assert ax.get_xticklabels() == ax2.get_xticklabels()

or something like that.

@@ -870,6 +870,8 @@ def _make_plot(self):
scatter = ax.scatter(data[x].values, data[y].values, c=c_values,
label=label, cmap=cmap, **self.kwds)
if cb:
if PATCH_MODE:
Copy link
Contributor

Choose a reason for hiding this comment

The reason will be displayed to describe this comment to others. Learn more.

I assume this ``PATCH_MODE` is just for debugging?

Copy link
Contributor Author

Choose a reason for hiding this comment

The reason will be displayed to describe this comment to others. Learn more.

yes, it should be removed. Didn't know of a better way to do this.

@@ -298,20 +298,20 @@ def _remove_labels_from_axis(axis):

def _handle_shared_axes(axarr, nplots, naxes, nrows, ncols, sharex, sharey):
if nplots > 1:

Copy link
Contributor

Choose a reason for hiding this comment

The reason will be displayed to describe this comment to others. Learn more.

This whitespace will likely fail the linter

if nrows > 1:
try:
# first find out the ax layout,
# so that we can correctly handle 'gaps"
layout = np.zeros((nrows + 1, ncols + 1), dtype=np.bool)
for ax in axarr:
layout[ax.rowNum, ax.colNum] = ax.get_visible()

Copy link
Contributor

Choose a reason for hiding this comment

The reason will be displayed to describe this comment to others. Learn more.

Likewise

@javadnoorb
Copy link
Contributor Author

As of subplots=True, I've only used it with histograms and line plots. I'm not familiar with their usage with scatter plots/hexbin plots. So I'm not sure how to test them. Simply using it with single plot doesn't interfere with the outcome, but I'm assuming that's not what you were referring to. I think we'll need your expertise here.

df.plot.scatter('A label','B label',c='C label', PATCH_MODE_FLAG = True, subplots=True);
image

@pep8speaks
Copy link

pep8speaks commented Mar 22, 2018

Hello @javadnoorb! Thanks for updating the PR.

Cheers ! There are no PEP8 issues in this Pull Request. 🍻

Comment last updated on July 04, 2018 at 03:04 Hours UTC

@codecov
Copy link

codecov bot commented Mar 22, 2018

Codecov Report

Merging #20446 into master will increase coverage by 0.02%.
The diff coverage is 100%.

Impacted file tree graph

@@            Coverage Diff             @@
##           master   #20446      +/-   ##
==========================================
+ Coverage    91.9%   91.92%   +0.02%     
==========================================
  Files         154      158       +4     
  Lines       49657    49705      +48     
==========================================
+ Hits        45638    45693      +55     
+ Misses       4019     4012       -7
Flag Coverage Δ
#multiple 90.3% <100%> (+0.02%) ⬆️
#single 41.99% <11.11%> (+0.09%) ⬆️
Impacted Files Coverage Δ
pandas/plotting/_core.py 83.57% <100%> (+0.03%) ⬆️
pandas/core/indexes/datetimes.py 95.48% <0%> (-0.18%) ⬇️
pandas/core/indexes/timedeltas.py 91.08% <0%> (-0.16%) ⬇️
pandas/core/indexes/period.py 92.53% <0%> (-0.14%) ⬇️
pandas/core/dtypes/cast.py 88.36% <0%> (-0.13%) ⬇️
pandas/core/indexes/accessors.py 90.09% <0%> (-0.1%) ⬇️
pandas/core/internals.py 95.53% <0%> (-0.07%) ⬇️
pandas/core/arrays/__init__.py 100% <0%> (ø) ⬆️
pandas/core/arrays/timedelta.py 100% <0%> (ø)
pandas/core/arrays/period.py 100% <0%> (ø)
... and 17 more

Continue to review full report at Codecov.

Legend - Click here to learn more
Δ = absolute <relative> (impact), ø = not affected, ? = missing data
Powered by Codecov. Last update dc45fba...7196d6e. Read the comment docs.

Copy link
Contributor Author

@javadnoorb javadnoorb left a comment

Choose a reason for hiding this comment

The reason will be displayed to describe this comment to others. Learn more.

removed the whitespaces

@TomAugspurger
Copy link
Contributor

Don't worry about subplots. It would be something like df.plot.scatter(x=0, y=[1, 2], subplots=True), which currently isn't allowed.

@javadnoorb
Copy link
Contributor Author

That test with assert doesn't deal with the issue. It seems like if you make a subplot and pass the axis to pandas, the x-axis comes out fine. I didn't use environments, and don't know how to switch from my development pandas to the native version without an uninstall. But with the PATCH_MODE_FLAG=False you can see it:

fig, ax1 = pl.subplots()
df.plot.scatter(x='A label', y='B label', c='C label',ax=ax1, PATCH_MODE_FLAG=False)

image

df.plot.scatter(x='A label', y='B label', c='C label', PATCH_MODE_FLAG=False)
image

@javadnoorb
Copy link
Contributor Author

This works:

PATCH_MODE_FLAG = False
ax1 = df.plot.scatter(x='A label', y='B label', PATCH_MODE_FLAG=PATCH_MODE_FLAG)
ax2 = df.plot.scatter(x='A label', y='B label', c='C label', PATCH_MODE_FLAG=PATCH_MODE_FLAG)
assert (ax1.get_xticks()==ax2.get_xticks()).all(), "axis labels are not the same"

but regardless of PATCH_MODE_FLAG value it doesn't throw an error.

I think the issue is not with the xticks attribute but rather showing them.

@javadnoorb
Copy link
Contributor Author

Trying a few of these. Quite bizarre:

PATCH_MODE_FLAG = False
ax1 = df.plot.scatter(x='A label', y='B label', PATCH_MODE_FLAG=PATCH_MODE_FLAG)
ax2 = df.plot.scatter(x='A label', y='B label', c='C label', PATCH_MODE_FLAG=PATCH_MODE_FLAG)
assert (ax1.get_xticks()==ax2.get_xticks()).all(), "Axis xticks are not the same"
assert ax1.xaxis.get_visible()==ax2.xaxis.get_visible(), "x-axis visbilities are not the same"
print(ax1.get_xticklabels(),ax2.get_xticklabels())
print(ax1.get_xticks(),ax2.get_xticks())
print(ax1.xaxis.get_visible(),ax2.xaxis.get_visible())

image

@TomAugspurger
Copy link
Contributor

@javadnoorb how's this going? For this PR I would ignore user-provided axes, and only worry about the common case of df.plot(x='x', y='y', c='c').

@javadnoorb
Copy link
Contributor Author

javadnoorb commented Mar 28, 2018

@TomAugspurger I haven't worked on this for a few days. Let me see if I can come up with a reasonable test. get_xticklabels returns an object, so I think we can't use it for comparison. I think the reason the x-labels disappear should be because of these three lines:

t.set_visible(False)

axis.get_label().set_visible(False)

t.set_visible(False)

my guess is that something like:

assert ax1.xaxis.get_majorticklabels().get_visible()==ax2.xaxis.get_majorticklabels().get_visible()

and

assert ax1.xaxis.get_label().get_visible()==ax2.xaxis.get_label().get_visible()

and

assert ax1.xaxis.get_minorticklabels().get_visible()==ax2.xaxis.get_minorticklabels().get_visible()

or something like that, should work for the test.

Let me give it a shot.

@TomAugspurger
Copy link
Contributor

TomAugspurger commented Mar 28, 2018 via email

@javadnoorb
Copy link
Contributor Author

Ok, I wrote a test that seems to work:

def test_if_colorbar_affects_xaxis_visibility(PATCH_MODE_FLAG=True):
    random_array = np.random.random((1000,3))
    df = pd.DataFrame(random_array,columns=['A label','B label','C label'])

    ax1 = df.plot.scatter(x='A label', y='B label', PATCH_MODE_FLAG=PATCH_MODE_FLAG)
    ax2 = df.plot.scatter(x='A label', y='B label', c='C label', PATCH_MODE_FLAG=PATCH_MODE_FLAG)

    assert all([vis[0].get_visible()==vis[1].get_visible() for vis in zip(ax1.xaxis.get_minorticklabels(),ax2.xaxis.get_minorticklabels())]), 'minor x-axis tick labels visibility changes when colorbar included'
    assert all([vis[0].get_visible()==vis[1].get_visible() for vis in zip(ax1.xaxis.get_majorticklabels(),ax2.xaxis.get_majorticklabels())]), 'major x-axis tick labels visibility changes when colorbar included'
    assert ax1.xaxis.get_label().get_visible()==ax2.xaxis.get_label().get_visible(),'x-axis label visibility changes when colorbar included'
test_if_colorbar_affects_xaxis_visibility(PATCH_MODE_FLAG=True)    

image
image

test_if_colorbar_affects_xaxis_visibility(PATCH_MODE_FLAG=False)
AssertionError                            Traceback (most recent call last)
<ipython-input-47-0cc25b4e00f4> in <module>()
     10     assert ax1.xaxis.get_label().get_visible()==ax2.xaxis.get_label().get_visible(),'x-axis label visibility changes when colorbar included'
     11 
---> 12 test_if_colorbar_affects_xaxis_visibility(PATCH_MODE_FLAG=False)

<ipython-input-47-0cc25b4e00f4> in test_if_colorbar_affects_xaxis_visibility(PATCH_MODE_FLAG)
      7 
      8     assert all([vis[0].get_visible()==vis[1].get_visible() for vis in zip(ax1.xaxis.get_minorticklabels(),ax2.xaxis.get_minorticklabels())]), 'minor x-axis tick labels visibility changes when colorbar included'
----> 9     assert all([vis[0].get_visible()==vis[1].get_visible() for vis in zip(ax1.xaxis.get_majorticklabels(),ax2.xaxis.get_majorticklabels())]), 'major x-axis tick labels visibility changes when colorbar included'
     10     assert ax1.xaxis.get_label().get_visible()==ax2.xaxis.get_label().get_visible(),'x-axis label visibility changes when colorbar included'
     11 

AssertionError: major x-axis tick labels visibility changes when colorbar included

image
image

If that seems fine I'll include the changes and remove the PATCH_MODE flag.

I'm not familiar with writing tests. Is this where it goes?
https://github.com/pandas-dev/pandas/blob/master/pandas/tests/plotting/test_misc.py

@TomAugspurger
Copy link
Contributor

That test seems sensible.

Tests can go in pandas/pandas/tests/plotting/test_frame.py under TestFrame. There are some other ones there for scatter.

removing PATH_MODE debugging flag
@javadnoorb
Copy link
Contributor Author

Ok, great. I'll check if it passes the regular checks before including the test.

remove whitespaces
@javadnoorb
Copy link
Contributor Author

Also need a test for hexbin. This one seems to work:

def test_if_hexbin_xaxis_label_is_visible(PATCH_MODE_FLAG=True):
    random_array = np.random.random((1000,3))
    df = pd.DataFrame(random_array,columns=['A label','B label','C label'])

    ax = df.plot.hexbin('A label','B label', gridsize=12, PATCH_MODE_FLAG = PATCH_MODE_FLAG);    
    assert all([vis.get_visible() for vis in ax.xaxis.get_minorticklabels()]), 'minor x-axis tick labels are not visible'
    assert all([vis.get_visible() for vis in ax.xaxis.get_majorticklabels()]), 'major x-axis tick labels are not visible'
    assert ax.xaxis.get_label().get_visible(),'x-axis label is not visible'
test_if_hexbin_xaxis_label_is_visible(PATCH_MODE_FLAG=True)   

image

test_if_hexbin_xaxis_label_is_visible(PATCH_MODE_FLAG=False)   
---------------------------------------------------------------------------
AssertionError                            Traceback (most recent call last)
<ipython-input-66-cd06ece40a4d> in <module>()
      9 
     10 
---> 11 test_if_hexbin_xaxis_label_is_visible(PATCH_MODE_FLAG=False)

<ipython-input-66-cd06ece40a4d> in test_if_hexbin_xaxis_label_is_visible(PATCH_MODE_FLAG)
      4 
      5     ax = df.plot.hexbin('A label','B label', gridsize=12, PATCH_MODE_FLAG = PATCH_MODE_FLAG);
----> 6     assert all([vis.get_visible() for vis in ax.xaxis.get_minorticklabels()]), 'minor x-axis tick labels are not visible'
      7     assert all([vis.get_visible() for vis in ax.xaxis.get_majorticklabels()]), 'major x-axis tick labels are not visible'
      8     assert ax.xaxis.get_label().get_visible(),'x-axis label is not visible'

AssertionError: minor x-axis tick labels are not visible

image

@javadnoorb
Copy link
Contributor Author

These changes seem pretty benign. Is there any specific reason for Travis-CI to throw an error?

@@ -311,7 +311,7 @@ def _handle_shared_axes(axarr, nplots, naxes, nrows, ncols, sharex, sharey):
# only the last row of subplots should get x labels -> all
# other off layout handles the case that the subplot is
# the last in the column, because below is no subplot/gap.
if not layout[ax.rowNum + 1, ax.colNum]:
if not layout[ax.rowNum + 1, ax.colNum] or getattr(ax, '_pandas_colorbar_axes', False):
Copy link
Contributor

Choose a reason for hiding this comment

The reason will be displayed to describe this comment to others. Learn more.

Copy link
Contributor Author

Choose a reason for hiding this comment

The reason will be displayed to describe this comment to others. Learn more.

Thanks. I'll fix it. Sorry I'm pretty new to the open-source world.

@javadnoorb
Copy link
Contributor Author

@TomAugspurger. Seems like the issue is because in the inline backend floats corresponding to location of axes have too many arbitrary trailing digits. For example two axes that have their bottom left corners at 0.3 may appear as 0.3 and 0.30000001. I rounded them in _core.py.

This new commit works for single plots with pdf and inline backends. It still fails for multiplots. We'll need to dig deeper for that. But it seems like we don't need the previous hack anymore.

# `get_points()` have too many ad hoc trailing
# digits. Unless rounded these values won't
# match in the following set operations
points = np.round(points, 3)
Copy link
Contributor

Choose a reason for hiding this comment

The reason will be displayed to describe this comment to others. Learn more.

I worry about this causing debugging nightmares further down the road... I'd prefer to solve this local to the problem if possible.

If not, you could perhaps include a keyword to _get_axes_layout? I'm not sure how difficult that would be to plumb through.

Copy link
Contributor Author

@javadnoorb javadnoorb Apr 13, 2018

Choose a reason for hiding this comment

The reason will be displayed to describe this comment to others. Learn more.

I agree. That's pretty tough to track. Might be better to avoid rounding off. Especially that 3 digit rounding is pretty arbitrary and may break in unknown ways.

I made a new commit. The changes are local now. I'm forcing colorbars to take on their relevant axes positions from the parent axes. The merge passes the tests and resolves the xlabel issue (#10611 and #10678) but not with the subplots (#20455).

javadnoorb and others added 4 commits April 12, 2018 23:23
* minor change in comment

* added condition on inline backend

* added condition on inline backend

* issue with floats determining the position of axes corners in ipython

* fixing axis position roundoff error locally
* minor change in comment

* added condition on inline backend

* added condition on inline backend

* issue with floats determining the position of axes corners in ipython

* fixing axis position roundoff error locally

* broken merge
@javadnoorb
Copy link
Contributor Author

I just remembered about this. The last commit seemed to have passed all the checks. Is there any interest to follow up on it?

Copy link
Contributor

@TomAugspurger TomAugspurger left a comment

Choose a reason for hiding this comment

The reason will be displayed to describe this comment to others. Learn more.

Sorry for dropping this. Can you merge in master and move the whatsnew to 0.24.0?

Looks good otherwise, so ping on green.

@@ -1176,7 +1176,7 @@ Plotting
- Bug in formatting tick labels with ``datetime.time()`` and fractional seconds (:issue:`18478`).
- :meth:`Series.plot.kde` has exposed the args ``ind`` and ``bw_method`` in the docstring (:issue:`18461`). The argument ``ind`` may now also be an integer (number of sample points).
- :func:`DataFrame.plot` now supports multiple columns to the ``y`` argument (:issue:`19699`)

- Bug in :func:'DataFrame.plot.scatter' and :func:'DataFrame.plot.hexbin' caused x-axis label and ticklabels to disappear when colorbar was on in IPython inline backend (:issue:`10611` and :issue:`10678`)
Copy link
Contributor

Choose a reason for hiding this comment

The reason will be displayed to describe this comment to others. Learn more.

This should be moved to 0.24.0

@@ -882,8 +882,13 @@ def _make_plot(self):
kws = dict(ax=ax)
if self.mpl_ge_1_3_1():
kws['label'] = c if c_is_column else ''
self.fig.colorbar(img, **kws)

cbar = self.fig.colorbar(img, **kws)
Copy link
Contributor

Choose a reason for hiding this comment

The reason will be displayed to describe this comment to others. Learn more.

Maybe refactor this and https://github.com/pandas-dev/pandas/pull/20446/files#diff-2b118bda866f3d626ceb6b529c62cd1aR932 to a method. They're identical, right? I guess aside from **kws vs. ax=ax?

@javadnoorb
Copy link
Contributor Author

javadnoorb commented Jun 30, 2018

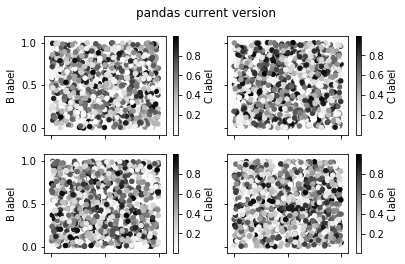
Thanks @TomAugspurger. I cleaned up the code. It's passing the tests. Here's what the output in jupyterlab looks like:

%matplotlib inline
import numpy as np
import pandas as pd
random_array = np.random.random((1000, 3))
df = pd.DataFrame(random_array,columns=['A label','B label','C label'])
df.plot.scatter('A label', 'B label', c='C label')

image

df.plot.hexbin('A label','B label', gridsize=12);

image

@jreback jreback added this to the 0.24.0 milestone Jul 4, 2018
Copy link
Contributor

@jreback jreback left a comment

Choose a reason for hiding this comment

The reason will be displayed to describe this comment to others. Learn more.

comments, otherwise lgtm. ping on green.

@@ -833,6 +833,23 @@ def _post_plot_logic(self, ax, data):
ax.set_ylabel(pprint_thing(y))
ax.set_xlabel(pprint_thing(x))

def _plot_colorbar(self, kws):
Copy link
Contributor

Choose a reason for hiding this comment

The reason will be displayed to describe this comment to others. Learn more.

can you make ax a named arg here and so you would pass as **kwds when you call.

# To deal with this, this method forces the colorbar
# height to take the height of the parent axes.
ax = kws['ax']
img = ax.collections[0]
Copy link
Contributor

Choose a reason for hiding this comment

The reason will be displayed to describe this comment to others. Learn more.

is there an issue we can reference about this impl. IOW next person to look at wouldn't know where these set_position come from. so a) ref this issue in a comment and b) an Ipython refernce (if you can)

@jreback jreback merged commit 62a0ebc into pandas-dev:master Jul 4, 2018
@jreback
Copy link
Contributor

jreback commented Jul 4, 2018

thanks @javadnoorb very nice!

@javadnoorb
Copy link
Contributor Author

thanks @jreback!

Sign up for free to join this conversation on GitHub. Already have an account? Sign in to comment
Labels
Projects
None yet
Development

Successfully merging this pull request may close these issues.

Hexbin plots does not display x label and xtick labels xticks missing for scatter plots with colors